Tested on fresh data, our high-win-rate setup wins less often but pays more
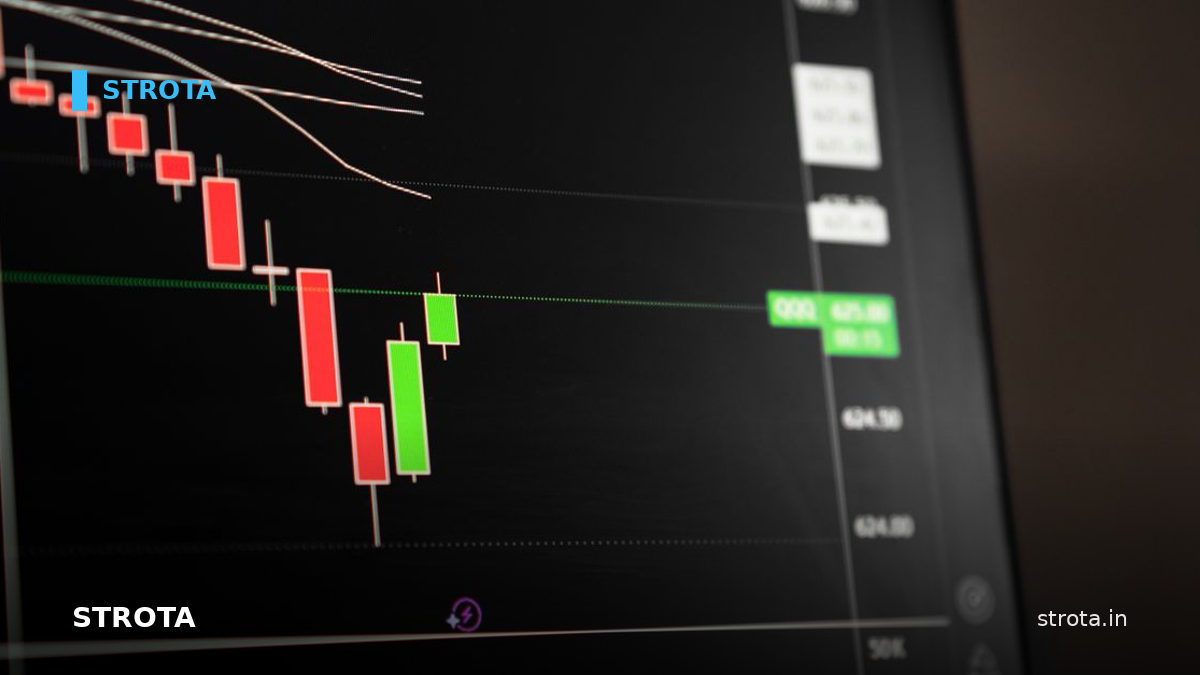
Strota builds and tests its own trading setups on Indian equity data. One of them carried an attractive number: in the sample it was designed on, the filtered version won somewhere between 66 and 80 per cent of its trades. That number has now met data it had never seen, twice, and missed both times. What survived is a different claim, and a better one: the filters are not picking trades that win more often. They pick trades that pay more when they win.
The session examined here is 18 June 2026: 62 resolved trades, 49 long and 13 short. Results are measured in R, meaning multiples of the amount risked per trade, so a trade returning 1 R made exactly what it stood to lose. Unfiltered, every long signal that triggered won 47 per cent of the time and averaged 0.149 R. The filtered longs, where the visible order book leaned toward buyers, averaged 0.265 R on a 46 per cent win rate. Marginally worse accuracy, close to double the payoff.
Stacking further conditions on top pushed the same pattern harder. Requiring the stock to also trade above its volume-weighted average price for the day lifted the average to 0.355 R while leaving the hit rate at 46 per cent. Requiring it to sit at the day's high dropped accuracy to 44 per cent. The most demanding conviction tier dropped it to 40 per cent. Each confirming condition raised the money made per trade and lowered the share of trades that made any.
This was the second session of a walk-forward test: rules frozen, then run on dates that played no part in creating them, so hindsight cannot flatter the result. The first such day produced 55 per cent; this one 46. Against an in-sample claim in the high sixties to around eighty, that is a failure to replicate, and better stated plainly than explained away. Only the first qualifying signal per stock and direction was counted, and the figures are idealised, assuming clean fills with no brokerage or slippage yet applied.
One result arrived exactly as predicted. The highest-conviction version of the setup requires a bullish market backdrop, and it fired zero times: all 62 trades were classified neutral, with no bullish ones at all. An earlier study in the same series had suspected the backdrop, rather than any trade-level filter, was the binding constraint on that tier. The previous day it fired once in 51 candidates. Zero in 49 here settles it for now. The best-looking pattern does not appear on ordinary days, so it cannot be the strategy by itself.
Short trades kept losing. Thirteen resolved, 54 per cent of them made money, and the group still finished down 0.60 R because the losers were bigger than the winners. That is three consecutive losing sessions on the short side, now the most consistent negative finding in the record, and negatives that repeat are worth more than positives that do not.
As a day, it was a directionless grind that closed modestly positive on the long book at 6.72 R before costs. A handful of large winners carried a book hitting under half its attempts, a shape matching two earlier sessions rather than an aberration.
Now the part that undercuts the tidy story. The supposedly independent confirming conditions were almost entirely redundant with the base signal: 48 of the 49 long trades were already at the day's high, and 44 of 49 already above their volume-weighted average price. When nearly every qualifying trade satisfies a filter anyway, the filter cannot be shown to contribute. Whether stacking confirmations adds edge is simply not isolable from this data, and may be partly illusory.
Other limits are structural. One trading day and a few dozen trades settle nothing statistically. Neither a bullish nor a bearish backdrop occurred, so the top tier and the rule governing shorts in falling markets both went untested.
The largest caveat sits at the top of the study's own list of things to do next. One exceptionally good earlier session accounts for 59 per cent of all profit in the entire record. Until that day is removed and the edge re-measured without it, the fair description of this setup is a harvester of trending days, not a high-win-rate system. That test remains unrun, and it is the one that matters.
A historical test is not an opportunity; it is a measurement of something that already finished, on a sample small enough that another month could overturn it. What the two out-of-sample days have done is move the question. The original goal was accuracy. The evidence keeps pointing at asymmetry instead, wrong slightly more often than the baseline and right by a wider margin. That is a different edge, and it would need a different way of taking profits. Letting a claim fail is how you learn which one you have.
Sources and method
This note is based on Strota's own backtest research. Historical results are not forecasts or investment advice; see the editorial standards for methodology and limitations.
More money stories
- Cutting a winning intraday trade early turned +41 into −2.6
- One trading day was enough to flip four supposed edges
- First live test of our best long setup: profits held up, the 80% win rate fell to 55%
- Phone prices rose 16 per cent, so brands pay your EMI interest
- Gold fell 5.1% in September, its worst month since June
- Jio's $3.8 billion IPO lands in the longest slump since 2001