New moon, full moon, same Nifty: 19 years of data show no reliable lunar effect
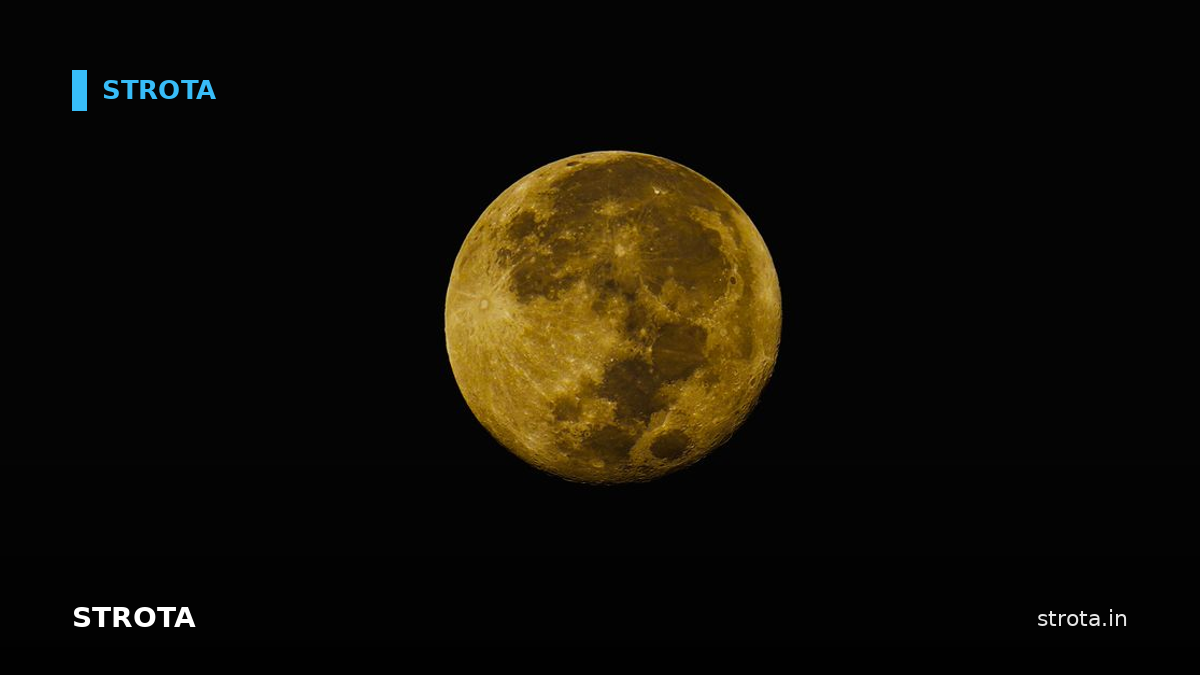
The moon does not move the Nifty 50 in any way we could detect. Across 19 years and 236 lunar cycles, trading days around the new moon did slightly better than days around the full moon, which is the direction the astrologers predict, but the gap was so small that random shuffles of the same data produced one at least as large 36% of the time. That matters because lunar timing is promoted in India as a market tool, and this is a clean test of its most checkable claim coming up empty.
Financial astrology has a genuine audience here, and of all its claims the lunar one is the easiest to put on trial. It even has academic backing of a sort: a widely cited 2003 paper by Dichev and Janes found that returns in many countries tended to be higher near new moons and lower near full moons. If that pattern were real and broad, India's flagship index is exactly where it should surface.
The test used Nifty 50 daily closes from 18 September 2007 to 16 October 2026, which comes to 4,681 trading days. Over that span there were 236 new moons and 236 full moons. Phase times came from Meeus's astronomical algorithm and were cross-checked against a separate astronomy library. Across all 870 phases compared, the two agreed to within 2.7 minutes, and only one phase, falling right at midnight, landed on a different IST date. Every date was assigned in Indian time.
A trading day counted as part of a new-moon window if it fell within 3 calendar days of a new moon, the same window Dichev and Janes used; full-moon windows were built the same way. Returns were daily log returns. To judge significance we made no assumption about how returns are distributed. Instead the labels were shuffled 20,000 times, and we asked how often pure chance matched or beat the real result.
New-moon windows covered 1,099 trading days, with an average daily return of +0.057% and 52.7% of days closing up. Full-moon windows covered 1,075 days, averaging +0.006% with 52.4% up. For comparison, all 4,681 days averaged +0.035%, with 52.9% up. So the new-moon side won by 0.051 percentage points a day. Shuffling produced a gap at least that wide 36% of the time, a p-value of 0.36. By any ordinary standard, that is not significant.
Breaking the record down by calendar year tells the same story. New-moon windows came out ahead in 12 of 20 years, which is only marginally better than flipping a coin.
The most eye-catching figure is the full-moon day itself. Across 138 such days the Nifty averaged -0.135%, and only 47.8% of them closed higher, while all other days averaged +0.040%. It looks like a warning sign. It is not one. The permutation p-value was 0.117, short of significance, and this was just one of several comparisons in the study. The more slices you test, the more likely one of them looks odd by accident.
That accident is easy to demonstrate. Divide the lunar month into 30 day-buckets and the best one, day 26, averaged +0.244%, while the worst, day 11, averaged -0.213%. On a chart, that spread would look like a tradable rhythm. But when the same returns were shuffled at random, the best bucket was at least that good 47% of the time and the worst at least that bad 23% of the time. With thirty buckets, a few extremes are all but certain to appear. They say nothing about the moon.
So what survived? Only the direction: the Nifty did a touch better near new moons, as the 2003 study would lead you to expect. What failed is everything that would make that direction matter. The gap cannot be separated from chance, the year-by-year record is close to a coin flip, and the full-moon-day dip does not pass the test either. Even taking the 0.051-point daily difference at face value, it sits far below what it costs to move in and out of the market twice every month.
There are honest limits. The study used daily closes only, so an effect timed to the exact moment of a phase and playing out within a single session would be invisible here. It covers one index; individual stocks or other markets could behave differently, though a broad lunar effect ought to have shown up in the Nifty 50 if it existed. And 19 years without evidence is not proof that the effect is exactly zero. It shows that whatever effect there might be is too small to detect, and far too small to trade.
Sources and method
This note is based on Strota's own backtest research. Historical results are not forecasts or investment advice; see the editorial standards for methodology and limitations.
More money stories
- Cutting a winning intraday trade early turned +41 into −2.6
- RBI opens a dollar window for 3 oil firms as the rupee nears 97
- Banks pay 5.67 per cent on new deposits while your EMI rises
- Air India adds Rs 1,200 fuel surcharge as jet fuel hits Rs 137
- EPF ceiling rises to Rs 25,000. Employers must not cut pay
- Phone prices rose 16 per cent, so brands pay your EMI interest